› Forums › Geocaching in Wisconsin › General › Wisconsin Cache Density
- This topic has 25 replies, 15 voices, and was last updated 12 years, 1 month ago by
zuma.
-
AuthorPosts
-
01/15/2009 at 11:21 pm #1727570
Someone had mentioned in a different thread that they would like to see something like this.
There’s not too many suprises. The major population centers have the highest concentration of caches. The area outside the boarders of the state are just “spread”, and don’t reflect any caches.
I’m not a GIS professional, so I make no claims of accuracy. 🙂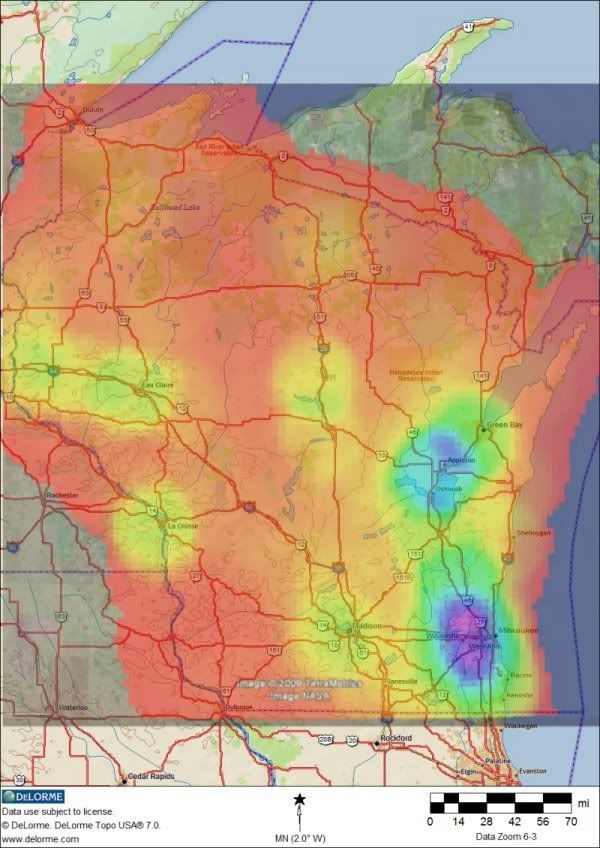 01/15/2009 at 11:26 pm #1900418
Very Cool.
01/15/2009 at 11:39 pm #1900419Nice job Brian. Definitely no surprises there, except maybe that slight yellow in the Minocqua area.
01/15/2009 at 11:42 pm #1900420I forgot to mention, but it’s pretty obvious that the colors range from RED to PURPLE in rainbow fashion.
ROYGBIV01/15/2009 at 11:47 pm #1900421Very cool! 8) What program did you use to figure this all out and do you know why Bullhead lake up north is th only lake name showing?
01/15/2009 at 11:59 pm #1900422Very pretty and very interesting!
If you don’t mind, I’d love to include this in my presentation….?
Bec
01/16/2009 at 1:06 am #1900423What program did you use to figure this all out and do you know why Bullhead lake up north is th only lake name showing?
This was the result of a lot of trial and error to get something that looked the way I though it should. I update all the caches in the state in GSAK every week. The hardest part of that is getting rid of archived caches because they don’t show up in PQs.
A Perl program (GeoQO) creates a 100 X 100 grid (or whatever density you want). It then counts the caches within each square and assigns it a color/hue. That’s all output to a .KML file.
The map overlay is created in Google Earth. It looked like crap over their spotty maps, so I set the transparency to 100% saved it as a .JPG. I layered the .JPG over a map from Delorme with PSP.
I’m not sure why Delorme picked that lake at that zoom level. It didn’t even label Wausau… I could adjust what gets labeled, but I think the map shows what was intended. It even shows a splash of color in the Hayward area!
01/16/2009 at 1:07 am #1900424@greyhounder wrote:
Very pretty and very interesting!
If you don’t mind, I’d love to include this in my presentation….?
Bec
Absolutly! I’ll email you a higher resolution one.
01/16/2009 at 2:06 am #1900425sweet map!! thanks for sharing with everyone. that is definitely a good one to share during “intro to geocaching” type presentation.
01/16/2009 at 2:19 pm #1900426@Team Black-Cat wrote:
I forgot to mention, but it’s pretty obvious that the colors range from RED to PURPLE in rainbow fashion.
ROYGBIVIs that how it goes? I thought they were ordered to honor the famous Russian chromotologist, Vib Gyor… 😆
Cool map! Is there a key for how dense each color represents?
01/16/2009 at 4:43 pm #1900427No, there isn’t a key because it’s all a bit arbitrairy. I do know from working with the numbers that it ranges from less than 1 cache per mile (red) to about six caches per mile in the purple. There are a few places where it actually spikes much higher than that (8-9 caches per mile), but the areas are so small that they got averaged into the surrounding areas.
01/18/2009 at 4:19 am #1900428@Team Black-Cat wrote:
No, there isn’t a key because it’s all a bit arbitrairy.
Hi everyone 🙂
I’m the primary author of GeoQO (though some friendly other folks have contributed their time in a number of ways). The color coding is fairly simple: whatever area it analyses it sets the lowest density spot to 1, and the highest (whatever that is) to be purple. So, in other words the color coding doesn’t give you a specific indication of the number of caches in an area. It merely indicates “more here than other places on this map”. If you plot the density over a really heavy area or a really sparse area, you’ll still get bright purple spots for the densest sub-area.
I’ve wanted to add a fixed scale option, but haven’t gotten to it yet.
01/18/2009 at 6:32 am #1900429Wow! Cool! Thanks Yamar!
I’m having fun playing with your program. The results turn out much better than my previous attempts.01/18/2009 at 9:14 pm #1900430@Team Black-Cat wrote:
Wow! Cool! Thanks Yamar!
I’m having fun playing with your program. The results turn out much better than my previous attempts.Glad to hear it. Next up on my immediate todo list is to actually add the overlay on the current in-program mapping using the open street maps data. That means you won’t have to open up google earth and the open street maps output is copyright free, so you can reproduce them at will (I’m not a lawyer though, so don’t take this as legal advice about what you can and can’t do with open streetmaps data).
01/18/2009 at 9:26 pm #1900431That would be cool. It would be fun to do the density map of placed caches over time to see how it changes, but the way I’m doing it would be a pain.
Do you know anyone who has done this for other states? -
AuthorPosts
- You must be logged in to reply to this topic.